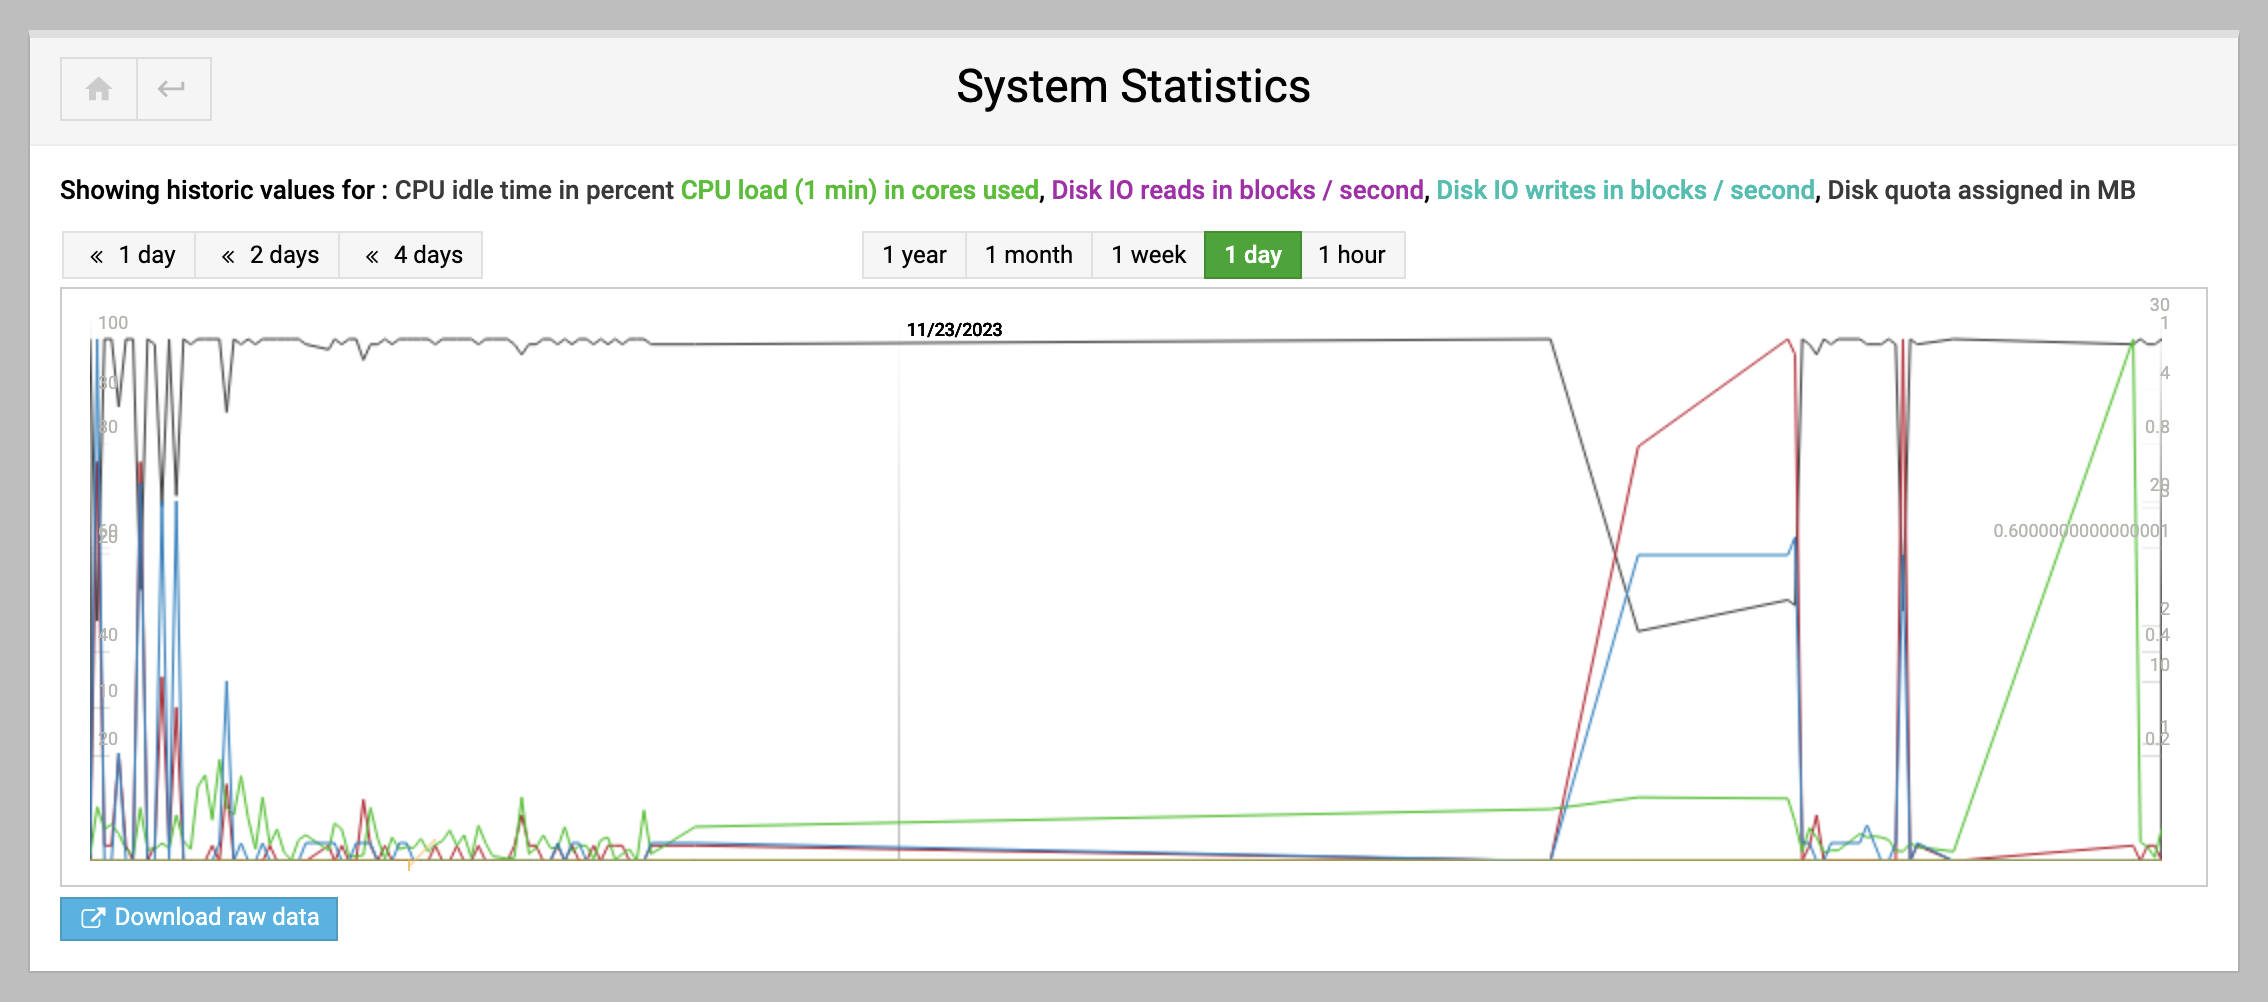
This tutorial provides guidance on utilizing the System Statistics feature in Virtualmin Pro, which offers graphical insights into your server’s performance and operations.
Accessing System Statistics
To access the System Statistics, you should already be logged into Virtualmin. Look for System Statistics in the bottom-left of the navigation menu and click on it to open the statistics dashboard.
Understanding the System Statistics Dashboard
The System Statistics page presents a variety of information in graphical form:
Historic Values Graph
- Displays a time-series graph showing statistics for a specific metric, such as CPU load (1 min).
- You can adjust the time range to view data from the last hour up to the past year.
- Hovering over the graph provides a tooltip with exact values at specific times.
- For raw data analysis, there is an option to download the data set.
Selecting Statistics to Display
- Below the graph, you’ll find checkboxes for different metrics that you can display on the graph. These metrics include CPU load over various intervals, CPU utilization details, email statistics, and system resource usage.
- Check the boxes next to the metrics you are interested in to customize the graph to show only relevant data.
Configurable Display Options
- You can choose which metrics to view, such as CPU utilization, email messages, system statistics, and counts specific to Virtualmin like the number of virtual servers or mail and FTP users.
- There’s an option to scale the vertical axis of the graph linearly or logarithmically, depending on the nature of the data you’re reviewing.
Using System Statistics
- To monitor server performance, you might regularly check CPU loads, memory usage, and disk I/O statistics.
- For email server monitoring, you can track the number of emails delivered, received, bounced, or marked as spam per minute.
- System resource checks might include tracking buffer cache usage, memory limits, running processes, and swap space utilization.
By customizing which statistics to display and analyzing the provided graphs, you can gain a better understanding of your server’s performance trends and potential bottlenecks. This data can be crucial for proactive system management and troubleshooting.
